Background
In 2022, BHCW, residents and three BOE Members (Khanna, Joly, Akiri) raised concerns about 2018-2019 Berkeley Heights Math, Science, and ELA proficiencies.
In 2023, BHCW published extensively on the 2021-2022 results, demonstrating significant drops in all three areas. During this time, BHCW developed a 7-district dashboard of comparable schools that had Berkeley Heights last in ELA, Math, and Science while also showing the highest per pupil cost of the seven districts. During this time, Dr. Foregger and Ms. Khanna brought up the issue of proficiency at BOE Meetings. The District finally added proficiency goals to district-wide planning. While the goals were anemic, it was the first time the District included these measures in a formal plan in recent history.
In December 2023, BHCW analyzed and published preliminary data on the 2022-2023 results demonstrating modest gains in all three areas. In February 2024, BHCW responded to an email sent out by the then Superintendent on the proficiency issue and followed up with an article to NJ Education Report in response to a District Press release.
The NJ Education Report article ended with the following statement:
With that said, and mainly as a result of the hard work of our teaching staff and advocacy on the part of the community, we appear to demonstrate very modest improvements despite the leadership of our District. Yet, we will be clear on how we compare to surrounding Districts once the DOE releases it’s performance reports later this year (based on preliminary data on state testing results for 2022).
Yesterday, BHCW published more encouraging information demonstrating that BHPSNJ rose in rankings and ratings.
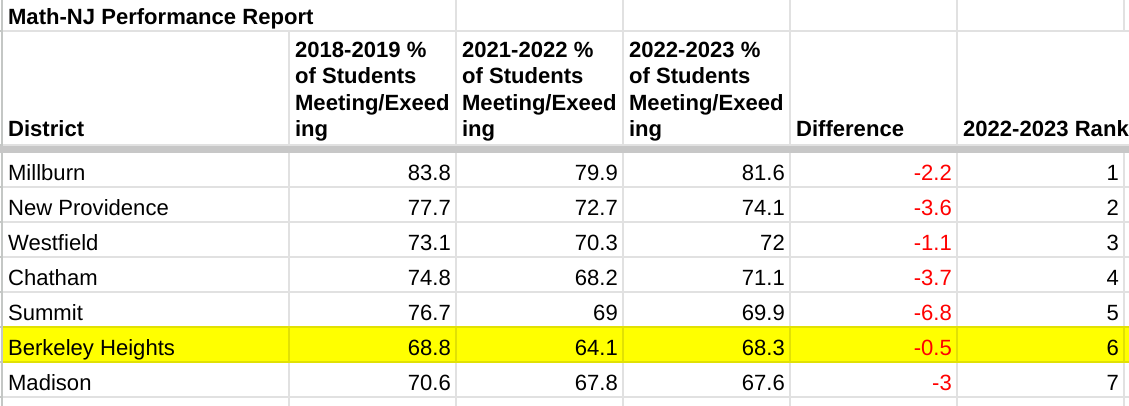
Under the Hood – District-Wide Results and Comparisons
While Berkeley Heights made gains in all three areas (English Language Arts, Math, and Science), the District is still below where it was during the 2018-2019 school year and remains close to the bottom on math.
In English Language Art’s 77% of Students met or exceeded- up from 68%

In Math, 68.3% of Students met or exceeded – up from 64.1%

In Science, 49.6% of Students met or exceeded – up from 45%

Overall, Berkeley Heights is – on average- 2.5 percentage points behind where it was from 2018-2019.

Keep in mind that our scores in 2018-2019 were nothing to celebrate.
Conclusion
So, the positives are that the District is improving and finally has proficiency somewhere on the radar in its planning documents, with four BOE members who have doggedly pursued this issue over the past three years.
The downside is that 32% of students not meeting math standards and 50% not meeting science standards still puts a school district in a good position compared to other districts.
While we can celebrate, there is still much work to be done – not just in this community but across the state.
We will be publishing school level data and comparisons on other indicators in the days and weeks ahead.
District Wide Source Data-Summary
District Wide Source Data-Detail