
Comparisons to the other Six Schools in Our Area
Based on the Superintendent’s assertion that Covid is one of the primary factors driving our declines, I decided to look at other Districts.
I compared movement on proficiency across the Districts that I have been running comparisons over the past month on Budget and Ratings/Rankings. These are top-level, district-wide comparisons.
The Science number in the screen captures below was the average of three District-captures (5th grade, 8th grade, and 11th grade) for each District.
Of the seven Districts Berkeley Heights had the largest decline in English Language Arts, the second largest decline in Science, and in Math, Berkeley Heights had the fourth-largest decline.
In ELA, the average decline among the seven schools was 5.2 percentage points, Berkeley Heights had a drop of 11 percentage points.

In Science the average decline was 5%, Berkeley Heights dropped 9 percentage points .

In Math, the average decline was 4.78 percentage points, Berkeley Heights dropped 4.7 percentage points.

That might seem like good news however, staying close to average on Math didn’t take Berkeley Heights out of last place in the subject out of the seven schools. In ELA, Berkeley Heights went from #5 to #7 on the list and in Science Berkeley Heights dropped from #4 to #6.
The table below demonstrates the overall 7 District Average between the several testing periods and where Berkeley Heights stood and stands.

In ELA Berkeley Height was nearly 6 points greater in its decline than the average and went from 5th to 7th in the rankings.
In Math Berkeley Berkeley Heights was 1 point less in its decline than the average but remained 7th on the rankings.
In Science Berkeley Heights was 4 points greater in its decline than the average and went from 4th to 6th in the rankings.
During the last meeting Ms. Bradford indicated “rankings fluctuate” – what you will notice however was that prior to this testing period Berkeley Heights was rather stable on both measures. Incremental increases on ELA and virtually no movement on Math (unfortunately). The rankings and ratings often poo-pooed by the District matter quite a lot in situations like these as they allow us to compare how we do with events like COVID – which affected every school.
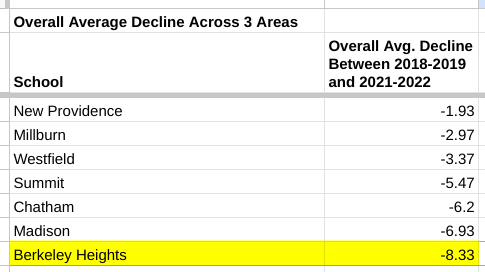
Lastly, the next table averages out the declines across all three subject areas for each school.

Berkeley Heights had the highest overall average decline out of the 7 schools I looked at.
I emailed the BOE with the Data (with the exception of the last table) and again requested that Dr. Varley present on this subject at the next BOE Meeting and take questions from the public.
Related Content:
THE STORY OF THE BHPSNJ DECLINE IN 5 PHOTOS
FOLLOW UP TO RATINGS AND RANKINGS FROM THE 05/11/2023 MEETING – JOHN’S NOTES PART II, THE REVENGE
05/11/2023 BOE MEETING-JOHNS NOTES
BERKELEY HEIGHTS PUBLIC SCHOOL RATING & RANKING DROP- CLOSER LOOKS


10 thoughts on “Five More Snapshots of the BHPSNJ Decline”