
Comparison of Mountainside, Berkeley Heights and what Happens At Governor Livingston….
I decided to look at Mountainside as their residents have a vested interest in a Superintendent’s report concerning Governor Livingston. Given the different k-8 configurations between Berkeley Heights and Mountainside, in the interest of time, I decided to average out the Berkeley Heights numbers except for Science and Algebra I (8th Grade test points were used) – this is just an exploration point -I am sure the Data Analyst on the Superintendent’s team can take a deeper look into this.
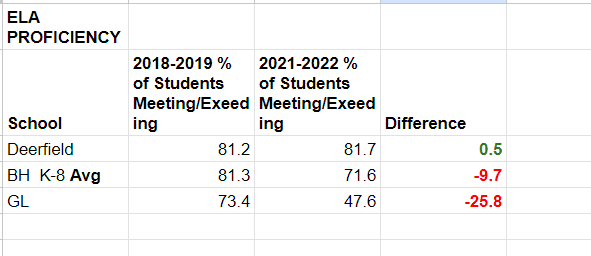
Mountainside did relatively well compared to Berkeley Heights in both Math and ELA. Mountainside families may be interested in the District exploring how impactful the decline in Governor Livingston scores were in connection to Mountainside Students.


On Algebra I, Mountainside scores were comparable to CMS; however, I could not find 2018/2019 scores for Mountainside.

Mountainside improved on Science.

I emailed the BOE with this information and again asked that they advise Dr. Varley to present on DOE reports during the next BOE Meeting. Thus far the only two BOE Members that have acknowledged any of the information I provided them are Ms. Khanna and Dr. Foregger.
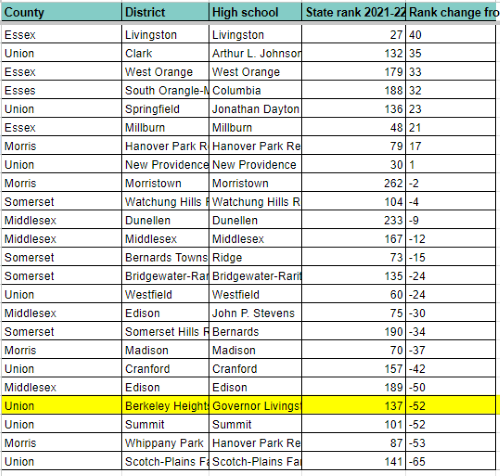
Again – the source for this data is the NJ DOE.
Related Content:
FIVE MORE SNAPSHOTS OF THE BHPSNJ DECLINE
THE STORY OF THE BHPSNJ DECLINE IN 5 PHOTOS
BERKELEY HEIGHTS PUBLIC SCHOOL RATING & RANKING DROP- CLOSER LOOKS
BERKELEY HEIGHTS HAVING THE HIGHEST PER-PUPIL COST WITH THE LOWEST RANKINGS MAKES SENSE
ONE MORE REALLY LONG ARTICLE ABOUT PROFICIENCIES AND METRICS

4 thoughts on “What About The Mountainside Kids?”